
My name is Claus Topholt and this is my personal blog. I’ve been delivering business-critical IT consulting and solutions for 15+ years.
Software Robots That Can Automate Anything
posted by claustopholt
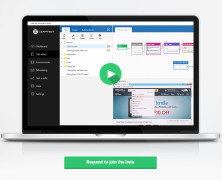
During the last 12 months, I have worked very hard together with my team of amazing developers on a new software product called LEAPTEST Automation Suite. LEAPTEST Automation Suite is a platform to configure software robots to automate anything across browsers, applications and devices. With this unique tool, it only takes a few minutes to configure and maintain a software robot because of the code free and intuitive building block workflow based on advanced image- and text recognition. Here’s a quick, 4-minute introduction to it all: https://www.youtube.com/watch?v=XSgv7OqoMHg There’s lots more to learn about the new company and product on...
A Simulated Distributed Microprocessor
posted by claustopholt
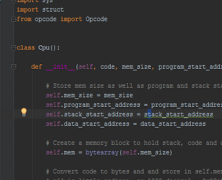
Here’s a virtual machine that simulates a microprocessor, built in Python.
Microcorruption Security CTF
posted by claustopholt
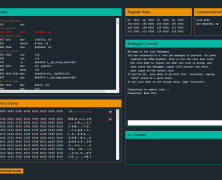
Capture the Flag and remind yourself that devices are made by people like you and me.

Mysterious App Pool Crashes? WinDbg is Your Friend
posted by claustopholt
Investigate root causes of application crashes with Windows Debugging Tools.
Boosting Performance and Productivity
posted by claustopholt
If you do it right, MongoDB can boost performance and productivity immensely.
Remote Copy with Powershell and MongoDB
posted by claustopholt
MongoDB and Poweshell are powerful allies in corporate infrastructure environments.

A Brand New .NET Language: Top#
posted by claustopholt
I recently implemented a full .NET programming language plus MSIL compiler.

DynaTrace to the Rescue!
posted by claustopholt
DynaTrace from Compuware is one of the world’s leading monitoring and profiling tools for live / production environments. It works in both Java and .NET environments and enables you to quickly perform root cause analysis on anything from performance bottlenecks to error storms. There are various vendors in the Application Performance Management (APM) space, including AppDynamics and the cloud-based New Relic. Most of these other products are more geared towards monitoring, whereas DynaTrace is more geared towards profiling, which is better suited for the way troubleshooting normally works, in my opinion. DynaTrace has both a browser and a server component, and by using both it’s possible to understand what happens all the way through a request. The browser component called Ajax Edition is free, whereas the server component comes with a (substantial) license cost. My focus is on the server component, which in brief terms requires a “collector” server to be installed on-site and “agent” services to be installed on each server you want monitored/profiled. Depending on the amount of assemblies and namespaces being instrumented, this leads to a performance degradation of typically between 10-25% on the server — a price often worth paying in order to troubleshoot live incidents. A “client” application is then used to connect to the server and analyze data as it streams in. This may sound a little bit complicated, but it’s actually very easy and quick to setup. Over the last 3-4 years, I have used DynaTrace on a more or less daily basis to perform the following tasks: Understand performance patterns in dev / test environments during code review Understand performance bottlenecks in live / production environments Troubleshoot live incidents, particularly related to database and external integration points Because of confidentialy constraints, I can’t show client screenshots,...

Create Your Own CLR Profiler in C#
posted by claustopholt
Here’s how to build a CLR profiler in C# that can be used in dev and test scenarios.